facet_stages
facet_stages.Rdfacet_stages
Arguments
- data
A data frame. For column requirements by chart type, see
vignette("data-requirements", package = "autospc").- split_rows
A vector of row numbers specifying the stages to display results at. Names specify facet strip labels.
- plot_chart
Boolean specifying whether to plot the chart. If not, the data is returned with centre line, control limits and other analytic output appended as columns.
- ...
Arguments passed to
autospc()
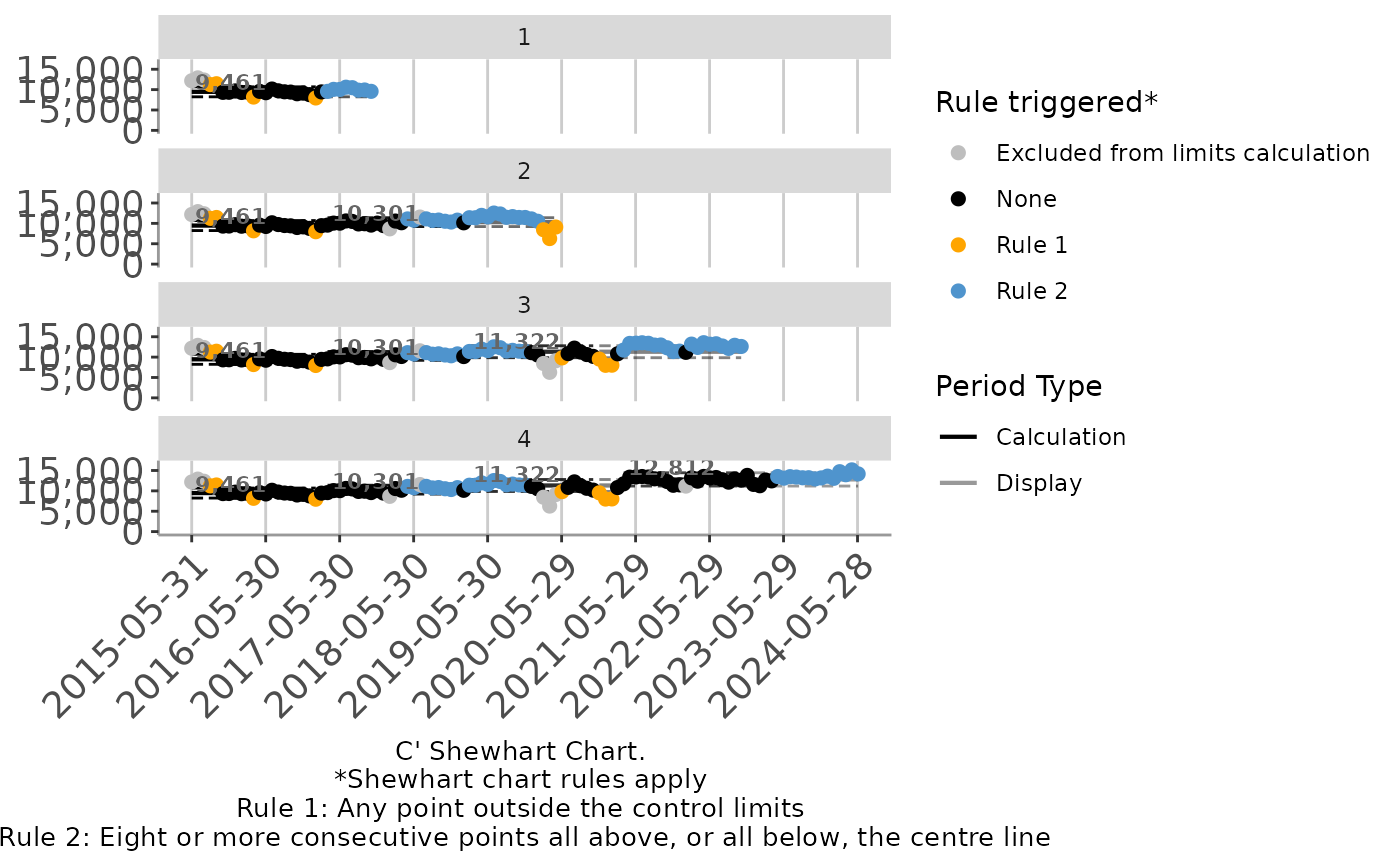
Value
Faceted plot showing results of autospc() at
different stages as specified by split_rows
Examples
# Show progression of C' chart for count of monthly attendances over time
facet_stages(
  ed_attendances_monthly,
  split_rows = c(30L, 60L, 90L),
  chart_type = "C'",
  x = month_start,
  y = att_all,
  x_break = 365
)